By Daniel Kalick, Director of Strategy, Monstarlab
Design has never been more respected in business. Yet quantifying its value still presents a challenge. We need a practical framework for estimating its impact on the bottom line.
It is a question frequently asked, yet the answer is almost always unsatisfying. Companies want to know the expected return of designing best-in-class products, services, and customer experiences. But a meaningful projection of ROI is notoriously elusive.
This is a very strange state of affairs if you think about it. On the one hand, companies have never invested more in design, either by building their own practices or working with outside partners. And this has a clear impact on our daily lives, where it is the design-forward brands that we truly love (and spend money on). On the other hand, the attempt to make a strong, numbers-based business case for placing the same bet everyone else seems to be making, from industry leaders to startups, typically results in head-scratching, fluffy generalisations, unfounded claims — or all of the above.
Consultancies like McKinsey have admirably tried to fill the gap, publishing a rigorous study showing a correlation between a company’s design prowess, on the one hand, and faster revenue growth and total return to shareholders, on the other. The study lends support to a hypothesis that is cropped up again and again for more than a decade: that investment in great design creates increased value for a company’s stakeholders, including a higher share price.
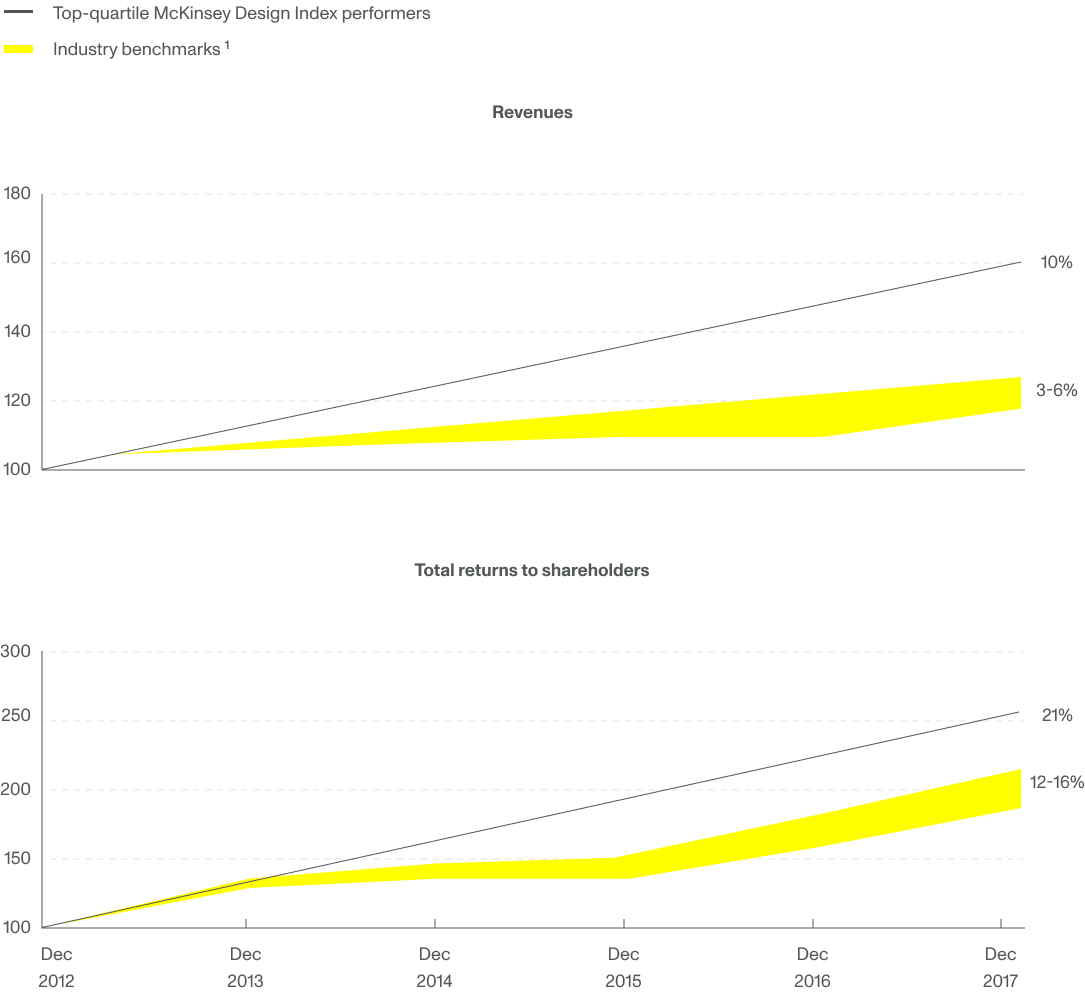 Source: McKinsey & Company
Still, while the McKinsey report and similar studies have advanced our thinking about the business value of design, they do not answer the critical ROI question for any one company. Macro studies across industries, including self-reported surveys, might offer a bit of encouragement to stakeholders deciding whether to green-light a design initiative. The same goes for concrete ROI success stories touted by other businesses. But what executives really want is the confidence that comes from defensible ROI projections. And for that what is needed is a framework for evaluating design’s expected impact on your company’s bottom line.
Towards a practical framework
A lot has been written on this subject in recent years, some of it useful at a high-level. But ultimately, when it comes to the nitty-gritty details of measuring the ROI of design, there is no consensus on the steps to take. And most of the advice on offer faces two critical setbacks.
On the one hand, it can be too simplistic, propelled by cookie-cutter formulas that ignore the challenge of drawing a straight line between design and revenue. This advice risks feeding unrealistic stakeholder demand for water-tight justifications based on cut-and-dry unit economics. On the other end, the guidance can be too complex, stressing the need to create bespoke ROI measurement schemes across a range of quant and qual metrics, some with an unclear relationship to revenue. This approach is nearer to the truth, as it embraces the rigour and multi-factor analysis needed to arrive at a comprehensive view of design’s business impact. But for many executives, it requires too much time and effort to be useful here and now.
At Monstarlab, we have developed a framework that aims to strike a practical middle ground, which we have used to help clients evaluate investments in everything from standalone apps to customer experience transformation initiatives that touch all areas of a business. The framework emphasises focused, justifiable projections that can be made with a bit of legwork, rather than an exhaustive all-hands-on-deck effort. And while it does not promise a one-size-fits-all ROI formula to which everything can be reduced, the framework helps guide you to the formulas that are right for your business and the design initiative under consideration. Part art, part science, it allows for creative thinking, but yields concrete, defensible numbers on which to base decisions.
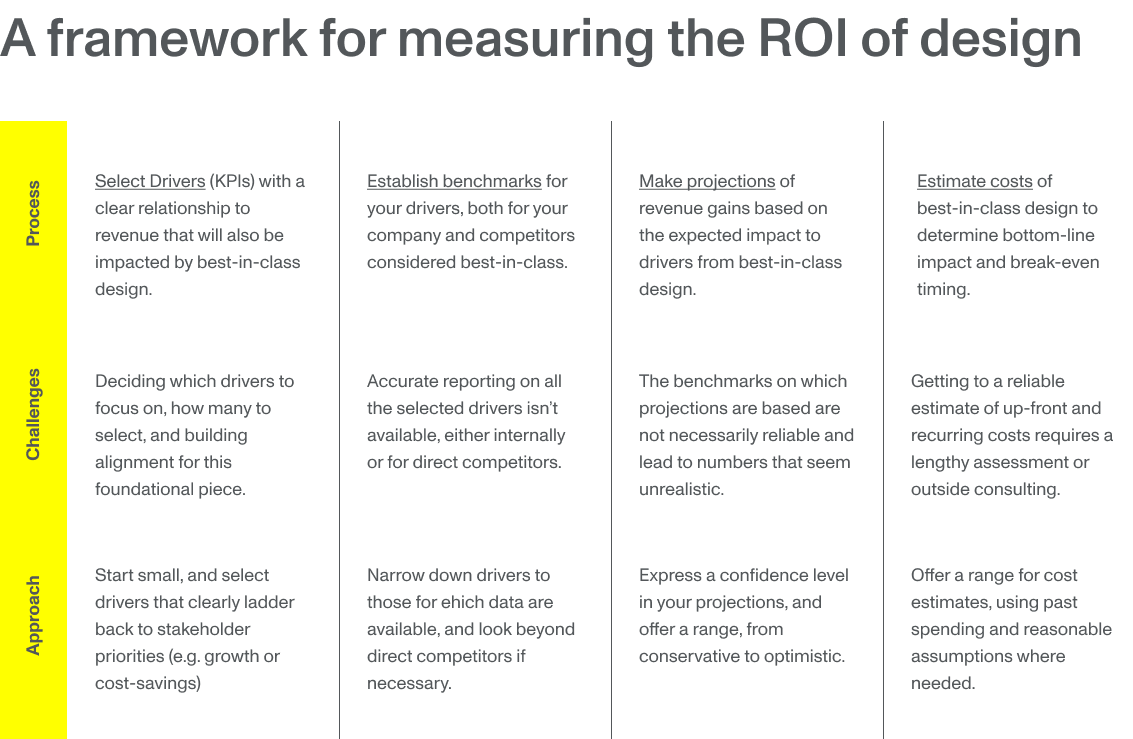
As shown above, the framework entails a four-step process that is honest about the challenges of projecting ROI and offers pragmatic advice for working through them. It is flexible enough to be used to measure ROI for design-centric initiatives small and large, from conversion funnel optimisation to more complex customer experience transformation initiatives, which can entail business goals spanning growth, productivity, and cost-savings. Crucially, the framework depends on benchmarking but is flexible enough to accommodate the busy teams and imperfect data sets that exist in many organisations.
The key is to start small and focus on what we call “drivers,” which are key performance indicators (KPIs) that are both influenced by design quality and directly tied to revenue. When the right drivers are selected, we can overcome the challenge of connecting design to business health, with measurable KPIs that allow us to compare the baseline performance of a product, service or customer experience to future iterations impacted by an investment in best-in-class design. All it takes is one driver to tell a meaningful story, but multiple drivers can be layered on to paint a more complete picture of the design’s business impact.
The best way to understand the framework is to see it applied to a concrete case study. The scenario below focuses on a make-believe restaurant brand called “Farmer Frank’s,” which is considering an investment in customer experience transformation. The business model at hand is similar to retail and direct to consumer, making it easy to imagine how the framework could be applied to a range of other industries and verticals.
Case study: Farmer Frank’s
Farmer Frank’s is a farm-to-table fast-casual restaurant that sells vegan sandwiches and salads made from locally-sourced ingredients. Established in 2014 as a food truck in Nashville, the brand quickly attracted a cult following, with hungry customers waiting in line for up to two hours. Seeing such high demand, the owners of Farmer Frank’s, a husband and wife duo, launched their first store in 2015, and from there the brand took off regionally and then nationally. Today, just seven years later, Farmer Frank’s boasts 110 locations across the US and is among the fastest-growing fast-casual brands in the country.
Farmer Frank’s made its first big investment in customer experience when it launched an order-ahead app in 2016, offering guests the convenience of ordering food at the push of a button and cutting the line at the restaurant’s notoriously busy locations. As customers began to adopt the app, the business not only saw revenue from a new channel but a slightly higher average order value (AOV) when compared to the in-store register. On the heels of this success, Farmer Frank’s made additional investments, adding web ordering in 2017, and in-store kiosks in 2018. All launched with out-of-the-box white label platforms, these channels have led to increased digital revenue.
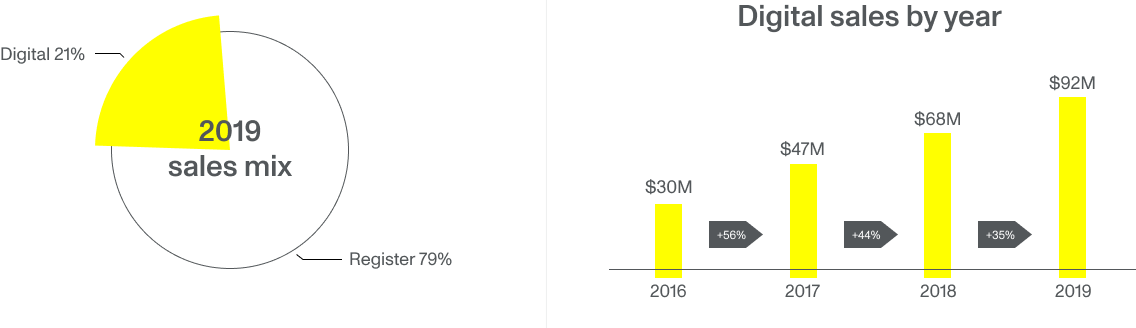
Today, Farmer Frank’s wants to push its customer experience to the next level, and the leadership is eyeing an investment in a robust, integrated digital ecosystem with a customised set of solutions. There are a few reasons for this. First, while the white-label platforms have served the business well, their one-size-fits-all nature cannot offer the control needed for a true expression of the brand’s unique identity, nor do they provide a consistent experience across channels. Second, while customers have started to adopt digital ordering, overall satisfaction scores are low compared to in-store register. Third, employees and managers are not thrilled either, as digital ordering is the source of many operational pain-points that need to be addressed. Fourth, delivery will soon be added to the mix, and leadership wants to integrate it directly into app and web, to avoid high third-party delivery costs. Finally, with best-in-class competitors like Sweetgreen touting an eye-popping 55% of revenue from digital (pre-Coronavirus), investors sense there is ample room to grow, as Farmer Frank’s is only at 21%, with digital growth slowing year over year.
Identifying drivers
What return can Farmer Frank’s expect from an investment in best-in-class customer experience? The business impact can be felt in a few areas, but the leadership is hungriest for revenue growth, so it decides to start the ROI estimation process there. As for drivers impacting this overarching goal, there are again a range of options to consider, but two KPIs, in particular, stand out: AOV and purchase frequency. This makes sense as a starting point because there is a pretty clear relationship between these KPIs and top-line revenue growth, on the one hand, and best-in-class customer experience, on the other.
Think about it. Top-notch digital ordering experiences, as seen from the Amazons of the world, are designed to serve personalised offers that customers are more likely to buy, with intelligent cross-sell and up-sell mechanisms driven by algorithms or even machine learning. This is convenient for customers because it saves time, and it is great for business, too. Making progress here could deliver higher AOV for Farmer Frank’s. Additionally, best-in-class customer experience entails personalised communication, including cross-channel promotions and loyalty. Assuming Farmer Frank’s can progress toward the likes of Starbucks in this area, it is likely to see a lift in purchase frequency. The bottom line: top-notch customer experiences entice customers to spend more, more often, and that means an increase in top-line growth.
Setting benchmarks
The next consideration in the framework is what data are available for setting internal and competitive baselines. Farmer Frank’s has readily available reporting on AOV across its digital and in-store channels, and also knows there is some good publicly available data on competitors for this metric. However, it does not have reliable purchase frequency data. This is a common roadblock; while it is possible to track the purchasing habits of authenticated users on the Farmer Frank’s app and website, kiosk and register do not require a login. Farmer Frank’s could expend additional effort to capture accurate purchase frequency data, but the leadership team recognises the ROI exercise need not be exhaustive to be meaningful.
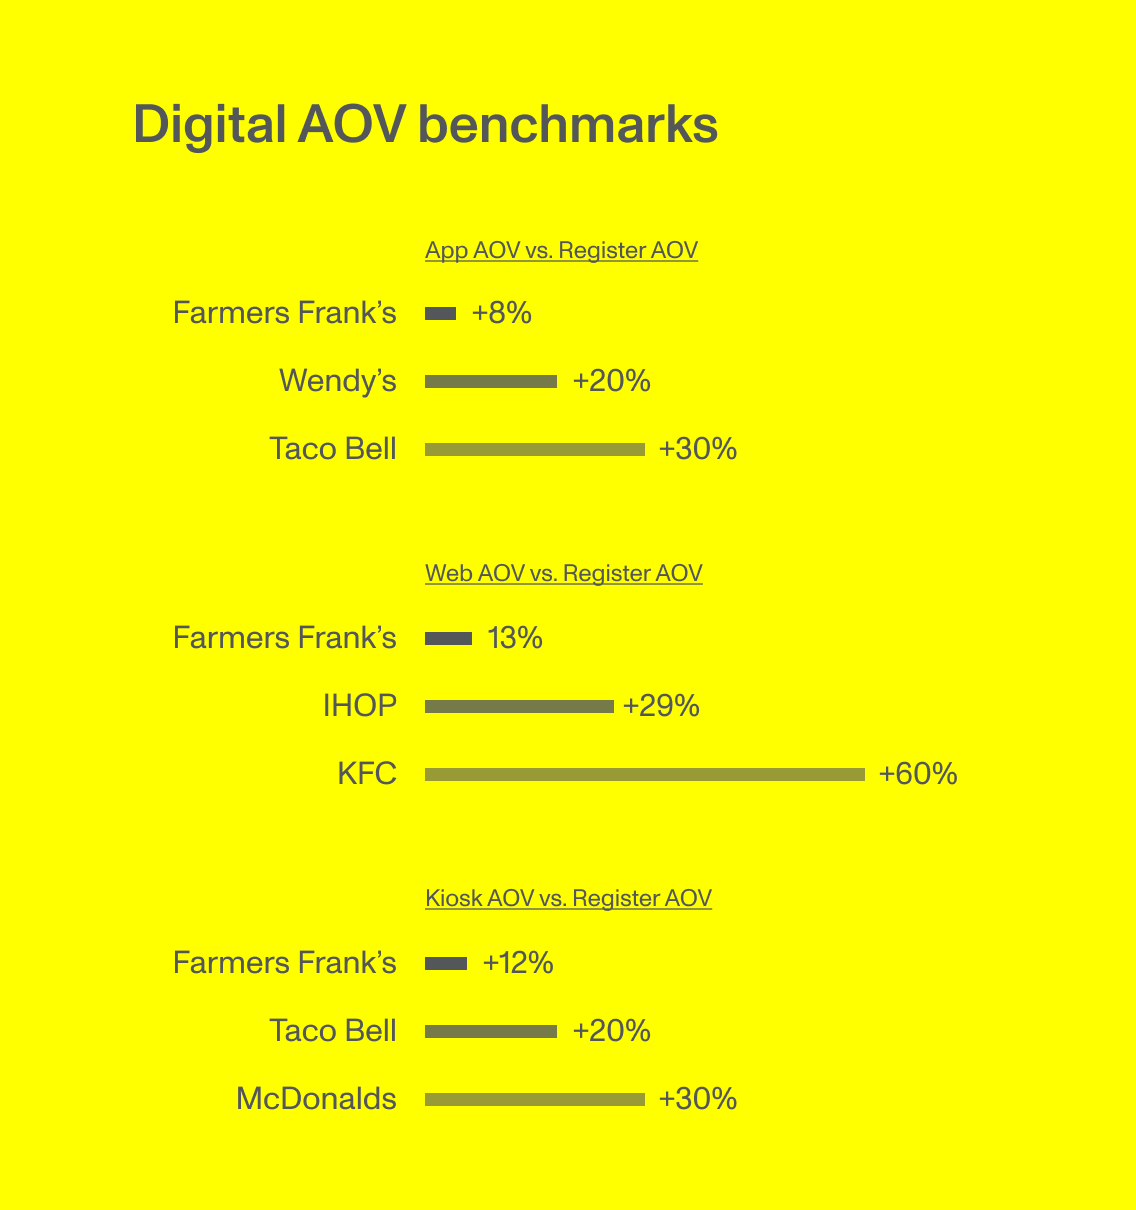
The team proceeds to paint a partial yet accurate picture with a focus on AOV, doing the legwork to collect data on best-in-class competitors out there in mainstream media, trade publications, and earnings reports. While it does not find cross-channel AOV data on its direct competitors, it finds a credible study noting a 20% increase in AOV for digital vs. register in the restaurant industry. The team supplements this benchmark with a few channel-specific data points for validation, finding increases of 20% for Wendy’s app, 29% for the IHOP website, and 30% for the McDonald’s kiosk. Overall, Farmer Frank’s underperformed by comparison. The average AOV increase across its app, web and kiosk is only 11%.
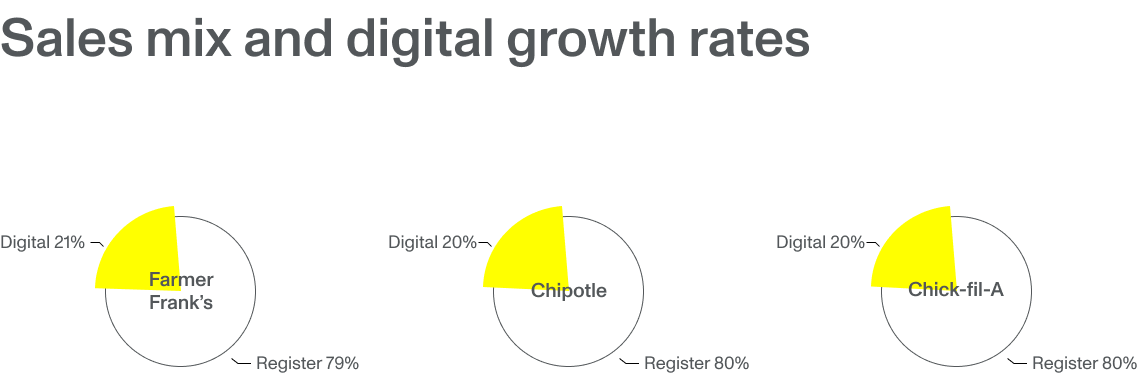
In the course of gathering benchmarks, the team also pieces together information on digital revenue growth rates from best-in-class competitors. Again, it sees a big difference. While the year over year growth rate of 35% from 2018 to 2019 achieved by Farmer Frank’s seems decent, other brands in the fast-casual space have grown at a much faster clip. Chipotle, reporting 20% of its sales through digital — similar to the 21% of Farmer Frank’s — experienced 78% growth after a big investment in digital. Chick-fil-A, also reporting 20% of its sales in digital, grew from roughly 11% the year prior, an 81% increase. Farmer Frank’s team documents these figures and starts to consider how this can factor into its ROI projection.
Projecting ROI
With internal and external benchmarks in order, the formula for estimating ROI starts to come into view. Farmer Frank’s team wants to understand the business impact of customer experience transformation, revenue growth in particular. To do that, the team wants to calculate the difference between the estimated revenue a higher digital AOV will yield in the future when Farmer Frank’s has a best-in-class customer experience that performs like its competitors, and the revenue yielded by a lacklustre digital AOV today. The team then wants to factor in the accelerated digital revenue growth rate expected once it is best-in-class. In its simplest form, the calculation looks like this:
Growth = Δ AOV x Δ Digital Revenue Growth Rate
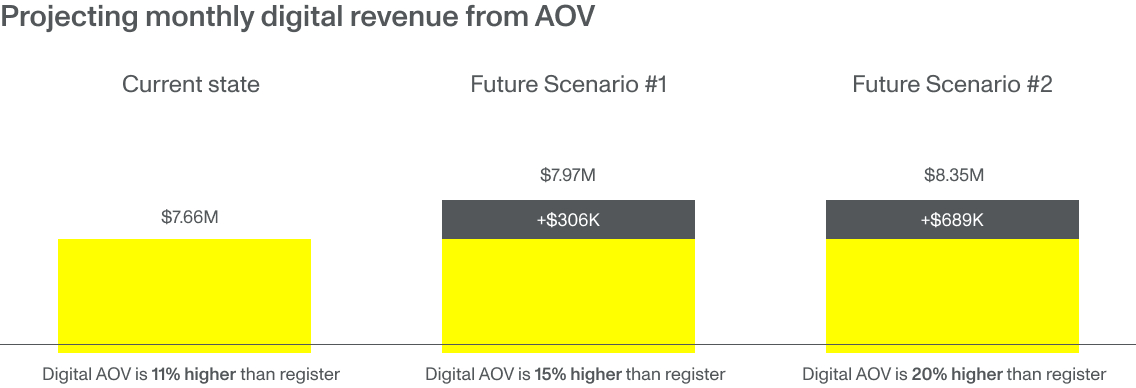
The team unpacks the formula and starts to plug in the numbers. Farmer Frank’s earned an average of $7.66M/month from its three digital channels in 2019, with an AOV that was 11% higher than in-store register. With a best-in-class customer experience, the team is very confident it can get to an AOV that is 15% higher than in-store register, a difference of 4% across digital channels. That would yield an additional $306K/month from digital channels, for a total of $7.97M/month in digital revenue, assuming total transactions hold. Given its benchmarking exercise, the team is even fairly confident Farmer Frank’s could get to a 20% higher AOV, which is what best-in-class brands achieve. The 9% difference over the current AOV performance would yield an additional $689K/month, for a total of $8.35M/month in digital revenue.
Now the team brings in the second factor, digital revenue growth rate. Digital reached 21% of total sales in 2019, a 35% increase from the previous year. Meanwhile, restaurant brands with a similar share of revenue through digital, like Chipotle and Chick-fil-A, saw growth rates closer to 80% after investing in customer experience. The Farmer Frank’s team factors this into the ROI projections, with high confidence it could achieve a digital revenue growth rate of 60% one year from the launch of a revamped experience. If Farmer Frank’s reached that rate of growth, which is almost twice its current rate, the estimated revenue increase from best-in-class digital would go from $689K/month to $1.18M/month one year from launch. With a growth rate of 80%, which the team has fair confidence in achieving, the increase would climb to $1.57M/month.
Considering costs
Additional monthly revenue of $1.18M to $1.57M would be very substantial for Farmer Frank’s. And this ROI analysis is only a partial story; a next-level customer experience will surely impact drivers like conversion rate and purchase frequency, which in turn will lead to increased revenue. In addition, there are anticipated cost-savings from a delivery solution that is not reliant on third parties, not to mention gains to productivity and employee retention from a reduction of pain-points on the operations side.
The fact that these additional business gains have yet to be quantified does not stop Farmer Frank’s from moving forward with its ROI analysis. With a partial yet defensible projection of revenue growth in hand, the team seeks to weigh the gains against the costs. It reaches out to its internal and external partners to understand the current state costs and begins to assess what it will take from an investment perspective to get to a next-level customer experience. Working together, they arrive at three potential paths forward: the first focused on optimising the customer experience within the brand’s existing framework of white-label platforms, and the second two centered on custom solutions, with varying degrees of control over the experience and the tech roadmap moving forward. The team works out high-level costs associated with each of the three paths and makes a recommendation for the middle ground option.
Conclusion
The story of Farmer Frank’s highlights just one tangible application of the ROI framework outlined above. While the case study focuses on customer experience transformation for a growing brand in the fast-casual restaurant space, the framework can be applied to design-centric initiatives pursued by companies across a range of industries, which all face a similar challenge of clearly making a connection between great design and a company’s bottom line. With a practical framework that takes a middle path between approaches to ROI that are either too simplistic or too complex, it is possible to establish defensible projections that can help teams understand the business case for investing in best-in-class products, services and customer experiences.